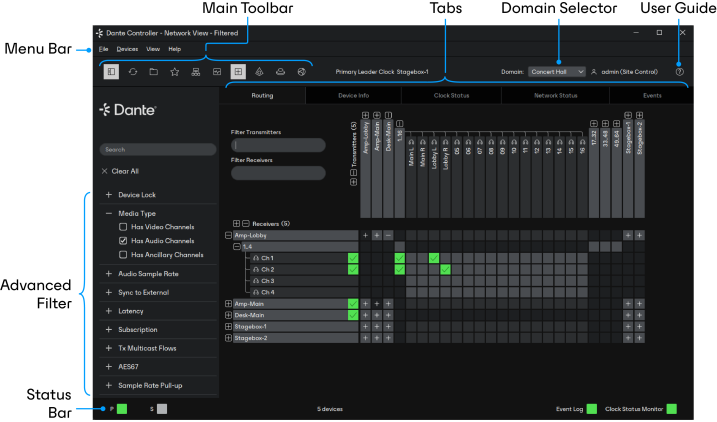
Network View
When Dante Controller is started, it opens at the Network View, with the Routing tab selected.
Note: For networks that include video (Dante AV) devices, see Routing for Video Devices
Menu Bar
The menu bar in the Network View includes four menus: File, Device, View and Help.
File
- Load Preset (Ctrl+L): loads a configuration from a file
- Save Preset (Ctrl+S): saves configuration for currently displayed devices to a file
- Interfaces: Opens the Configure Dante Interfaces dialog
- Exit (Alt+F4): Exits Dante Controller
See Presets for more information.
Devices
- Refresh (F5): Refreshes the displayed network / device data
- Clock Monitoring: Toggles clock monitoring on/off
- Connect Devices to DDM / Dante Director
- Device View (Ctrl+D): Opens a new Device View window
View
- Dante Updater (Ctrl + U)
- Dante Activator (Ctrl + I)
- DDM / Dante Director Login (Ctrl + O)
- Language: Select the user interface language. Set to 'Auto' to use the default operating system language.
- Theme: Switch between light and dark mode. Set to 'Auto' to use the system default.
- Device scale: Switch between default and compact views for the routing pane. Use compact if you have a lot of devices and want to see more on-screen.
- Show Filter Pane (Ctrl + Shift + F)
- Show/Hide Channel Groups (Ctrl + Shift + G)
- Show Hidden Devices (Ctrl + E)
- Swap Routing View Axes: Switch between Receivers on the left and Transmitters on the top, or Transmitters on the left and Receivers on the top.
Help
- About: Shows the Dante Controller version, and current event log file location
- Show License: Displays the license text
- Check for updates: Checks the update server for new Dante Controller versions
- Analytics: Disable / enable analytics data collection
- Feedback: Opens your default browser at the Audinate Product Feedback form
- Online Help (F1): Opens this HTML user guide on the Audinate web server (requires an Internet connection)
- Offline Help: Opens a locally-stored PDF of this user guide (may not be the latest version of the user guide)
Tool Bar
Below the menu bar there is a tool bar, containing these buttons:
|
|
Filter pane | Shows / hides the advanced filter pane. |
|
|
Reload Device Information | Updates the current view with the latest device information from the network. This is useful when a recent change to the network has not yet propagated automatically through to Dante Controller (for example, a new device has been added to the network). |
|
|
Load Preset | Loads a previously saved media routing configuration. See Presets for more information. |
|
|
Save Preset | Saves the current media routing configuration. See Presets for more information. |
|
|
Choose a Dante Interface | Opens the Configure Dante Interfaces dialog. See Configuring Dante Controller for more information. |
|
|
Clock Monitoring | Activates the Clock Status Monitoring function. See Clock Status Monitoring for more information. |
|
|
Channel Groups | Activates channel groups. See Channel Groups for more information. |
|
|
Dante Updater | Launches Dante Updater. |
|
|
Dante Activator | Launches Dante Activator. |
|
|
Domain Manager Login | Enables connection to a Dante Domain Manager server. |
To the right of the toolbar, Dante Controller displays the current Primary Leader clock (or clocks, in the case of redundant networks or DDM networks).
To the right of the clock display is the currently-selected domain, and the currently logged in DDM user (when logged into Dante Domain Manager).
Tabs
Click the tabs below the tool bar to view:
The use of each of these tabs is described in the next section.
Status Bar
The Status Bar displays notifications for network status, general device events, and clock status events, plus the current Dante media multicast bandwidth on the network.
DDM Networks
In DDM networks, the devices displayed in the Network View will vary according to the selected domain. See Viewing Domains in Dante Controller for more information.
When logged into a domain that includes legacy (pre-v4.0 firmware) devices, those devices are displayed with gray highlighting instead of blue.
Shared devices are displayed with green highlighting and green text. See the DDM user guide for more information about sharing audio in DDM networks.